RDLS: User guide
James Todd - 3228071
David Price - 3226711
Michael Carter - 3221924
Tom Rowlands - 3227129
The software may have been obtained as rdls.tar.gz or on a cd. The details for
installing from the tar.gz file can be found in the INSTALL file within the
package.
From cd, a version for your operating system may be chosen, and moved to a
directory on the hard drive from which you wish to run it. During execution this
directory will then store a configuration file (about 7k of data). Other disk
space may then be used if you wish to log to a file. The log file sizes are dependant
on the rate of logging by the data device.
        + RDLS
        |
        ------ + win32
        |      |
        |      ------   rdls.exe
        |
        ------ + solaris
        |      |
        |      ------   rdls
        |
        ------ + linux_x86
        |      |
        |      ------   rdls
        |
        ------ + src
        |
        ------ + docs
The program can be executed from the directory it has been created in under
windows by double clicking on it. Under other operating systems, it may be
executed from the command line as "rdls".
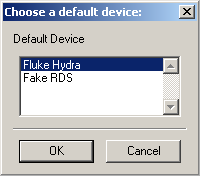
While this software has been written to be used primarily with a Fluke Hydra
2635A, a "Fake RDS" (Remote Data Source) has been constructed to allow for use
and testing with out any device. When run for the first time with no config file
(or if the config has been deleted), you are presented with the screen shown in
Figure ![[*]](crossref.png) . This allows you to choose which device you would like RDLS to
default to when running. In future versions we anticipate that other logging
devices will be available.
Caution: If Fluke Hydra is selected but not connected, the program will
sit waiting to connect to it.
. This allows you to choose which device you would like RDLS to
default to when running. In future versions we anticipate that other logging
devices will be available.
Caution: If Fluke Hydra is selected but not connected, the program will
sit waiting to connect to it.
Figure:
Default Data Device
|
|
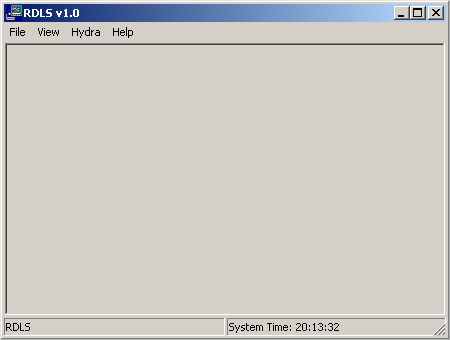
The main screen, while initially looking bare is actually a powerful dynamic
display. It is possible to add and remove text based displays and graphs of any
available data sources.
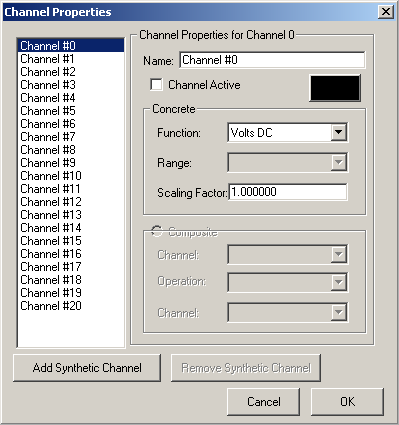
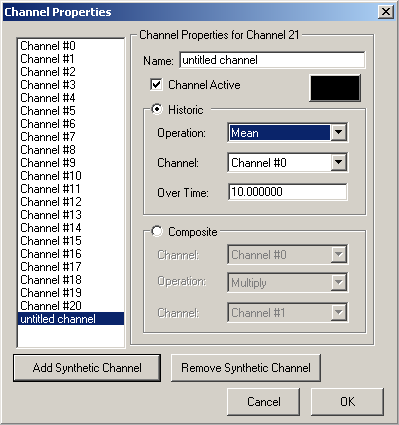
Channels are the means by whcih this software gets its data, and hence some
must be made active before you can actually log any data into the system. By
opening the dialog box shown in Figure from the Hydra->Configure
Channels menu, you get a chance to turn on channels.
By selecting a channel from the selction box on the left, then checking the
"Active" checkbox, a channel is made active in the system. Other options you may
wish to try out at this stage are renaming the channels, and changing their
colour (which is used when graphing and showing values later). Synthetic
channels are channels that are comprised commonly of ordinary channels which
have been mathematically manipulated. More on synthetic channels can be found in
a later section.
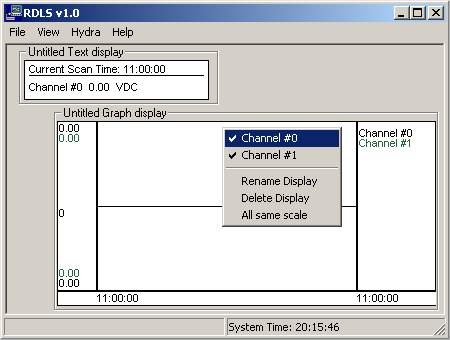
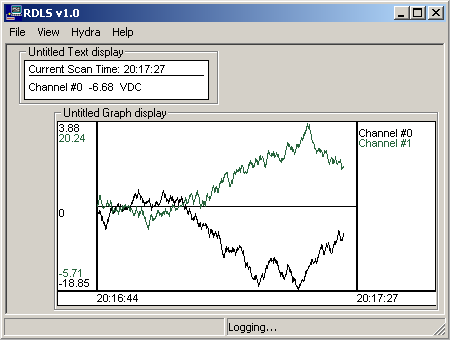
Displays are the main means in which you can see the data coming into the
system. By selecting the View->Add Text Display menu option, you create a text
based display that can be moved around within the window. By right clicking on
this display you are presented with a list of any active channels within the
system, as well as an option to rename or delete the display. You may also add a
graph display which behaves in a similar fasion to the text display in that you
can add and remove channels from it, rename or delete it. An extra option is
added to graphs, "Use same scale" which basically determines whether you want
each channel to have its own vertical scale, or whether you want them to be all
on the one scale. Figure shows the main screen with a text
display and a graph display added, as well as the right button depressed to
bring up the context menu.
To start logging data into the system, you may choose the menu option
Hydra->Start Logging. This will start to bring data into the system. If channels
are active, and they have been selected on either a text display or a graph,
they will be shown onscreen like in Figure .
Congratulations! You have now got the grips of the basic features of RDLS. You
can now look at the More Features section to learn how to perform more detailed operations
within the program.
RDLS can log all incoming data to a file. This file can be read back in at a
later stage, and possibly resumed. This is done using the File->New and the
File->Open menus.
Logging to a file has the advantage that synthetic channels can be created and
calculated from historic data from when logging began. If logging has not been
to a file, the synthetic channels can only calculate from when they were
created.
A CSV (Comma Separated Values) file can be exported when data has been logged to
a file. This file format can be read into spreadsheet programs such as Microsoft
Excel, or other programs which may provide a greater level of graphing
versatility.
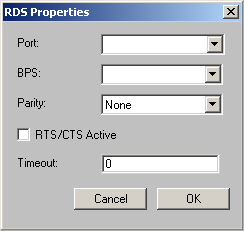
The serial options of the Fluke Hydra may be changed within this dialog box.
When running the system with the Fake RDS, this dialog box has no effect.
Synthetic channels allows you to create values in the system that are derived
from values recorded from the remote data device. This means that it is possible
to determine the power used by a device by multiplying the read in current and
voltage, or the derivative of speed to give acceleration etc. More detailed
formulae may be constructed by having synthetic channels derived from other
synthetic channels.
When selecting a historic synthetic channel, the time entered into the "Over
Time" field is used to determine the length of time over which the operation should be
calculated (in seconds). Setting this to 0 will result in the synthetic channel
being calculated over all time recorded.
Note: A synthetic channel can not be removed if other synthetic channels
still depend on it
The configuration file for RDLS is a human-readable file that can be
edited using an ordinary text editor. This can be helpful if
something goes wrong with the program. There are also some program
options that are mainly for debugging purposes, and as such cannot be
changed via the user interface. These options can be changed by
editing the config file.
The first of these options is /use_fake_data_source, which can be
set when the program is first launched, but not after that (unless the
config file is deleted). When set to on (1), this uses a fake data
source instead of the Fluke Hydra. This fake data source produces random,
sine or constant output depending on a setting in its configuration.
Alternatively, if a file named ``sample.rdl'' exists in the directory from
which RDLS is run, then that will be read as input. This can be useful
for reproducing conditions that may have caused the program to behave
incorrectly.
The startup sequence that is sent to the fluke can be changed by
editing the configuration file. The startup sequence is defined in
/HydraMonitor/sequences, in the section named ``initalise''. This
sequence is a set of command names which are defined under the
/HydraMonitor/commands section.
The fake data source has a few customisations that can be made by
editing the configuration file. ``output_regularity'' determines how
many 20ms periods between each output of fake data.
``realtime_fileread'' if set to 1, and reading data from a file, will
``playback'' that data at the same speed at which it was logged. ``mode''
is one of ``random'', ``sine'' and ``constant''. These determine the type
of data output.
RDLS: User guide
This document was generated using the
LaTeX2HTML translator Version 2K.1beta (1.48)
Copyright © 1993, 1994, 1995, 1996,
Nikos Drakos,
Computer Based Learning Unit, University of Leeds.
Copyright © 1997, 1998, 1999,
Ross Moore,
Mathematics Department, Macquarie University, Sydney.
The command line arguments were:
latex2html -no_navigation -local_icons -no_math -split 0 user-guide.tex
The translation was initiated by David Price on 2001-10-16
David Price
2001-10-16